matplotlib 入门

matplotlib 入门

初识 Matplotlib

Matplotlib 是 Python 中常用的可视化工具之一,使用它可以方便的创建二维图和一些基本的三维图表

基础画图
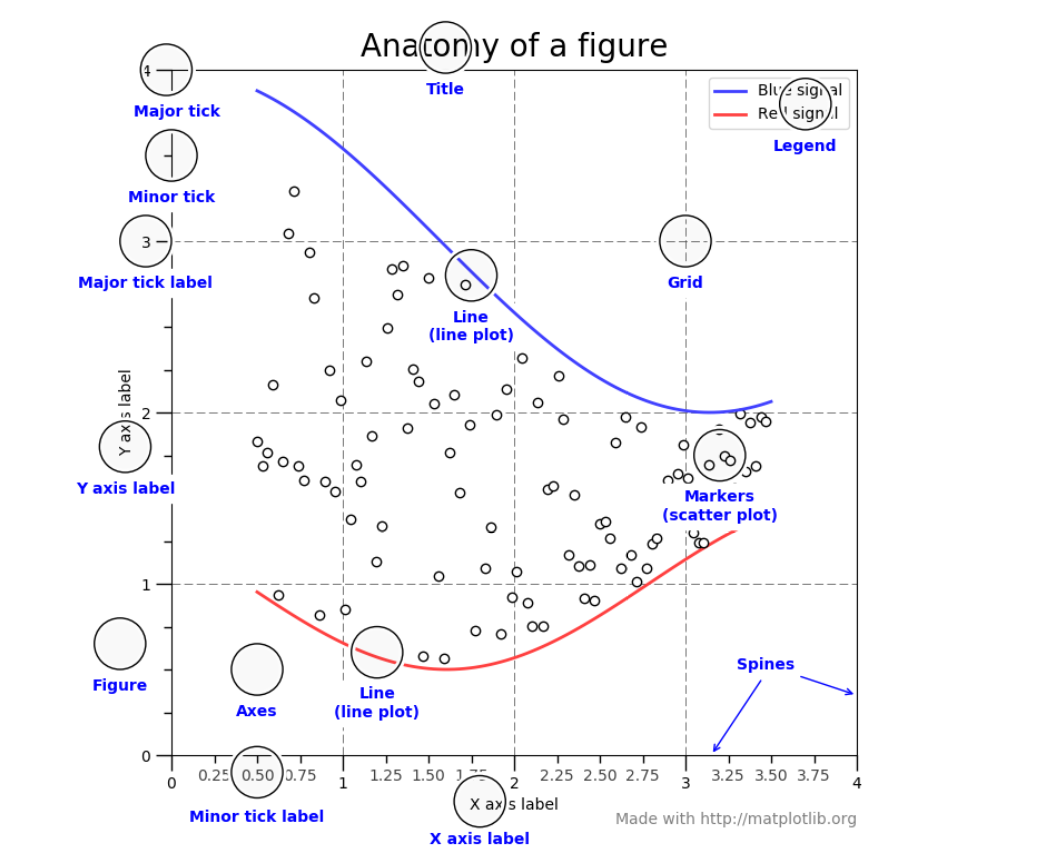
matplotlib.png

1
2
3
4
5
6
7
8
9
10
11
12
13
14
15
16
17
18
19
20
21
22
23
24
25
26
27
28
29
30
31
32
33
import numpy as np
import matplotlib.pyplot as plt

x = [1, 2, 3, 4]
y = [3, 5, 10, 25]
plt.subplot(241)
plt.plot(x, y)
plt.title("plot")
plt.subplot(242)
plt.scatter(x, y)
plt.title("scatter")
plt.subplot(243)
plt.pie(y)
plt.title("pie")
plt.subplot(244)
plt.bar(x, y)
plt.title("bar")
plt.subplot(245)
plt.boxplot(y, sym='o')
plt.title("box")
plt.subplot(246)
t = np.arange(0, 5, 0.2)
plt.plot(t, t, 'r--', t, t**2, "bs", t, t**3, 'g^') # 'r--' 字符串指定的绘制线条颜色和类型
plt.title("Pyplot Three")
delta = 0.025
cx = cy = np.arange(-3.0, 3.0, delta)
X, Y = np.meshgrid(cx, cy)
Z = Y**2 + X**2
plt.subplot(247)
plt.contour(X, Y, Z)
plt.colorbar()
plt.title("contour")
plt.show()

上面的简单例子展示了绘制各种类型的基础图形

1
2
3
4
fig = plt.figure()  # an empty figure with no axes
fig.suptitle('No axes on this figure') # Add a title so we know which it is

fig, ax_lst = plt.subplots(2, 2) # a figure with a 2x2 grid of Axes

官方文档里给出的一种写法是先创建一个 figure 然后在用 subplot 指定 figure 的大小
但是,实际上 pyplot 模块会在需要的时候自动帮我们创建一个 figure

For functions in the pyplot module, there is always a “current” figure and axes (which is created automatically on request).

我们使用 plt.plot 来绘制一个线性函数,并且可以使用 label= 来指定函数的名字
需要注意的是你的 x 和 y 必须是两个列表

1
2
3
4
5
6
7
8
9
10
11
12
13
14
x = np.linspace(0, 2, 100)

plt.plot(x, x, label='linear')
plt.plot(x, x**2, label='quadratic')
plt.plot(x, x**3, label='cubic')

plt.xlabel('x label') # x 坐标的名字
plt.ylabel('y label')

plt.title("Simple Plot")

plt.legend() # 将标签绘制到图中

plt.show()
  • legend() 也可以指定参数来标记每个函数的 label

line, = ax.plot([1, 2, 3])
legend((line1, line2, line3), (‘label1’, ‘label2’, ‘label3’))

  • plt.plot 通过指定 marker=‘字符’ 来改变绘制出来的点的样式
  • plt.plot 会返回每个画的线条,以元组的形式,我们只需用, 来解包即可
  • plt.plot 线条的相关属性标记设置
线条风格linestyle 描述
‘-’ 实线
‘:’ 虚线
‘None’ 什么都不画
‘-.’ 点划线
线条标记marker 描述
‘o’ 圆圈
‘.’
‘D’ 菱形
‘s’ 正方形
‘h’ 六边形1
‘*’ 星号
‘H’ 六边形2
‘d’ 小菱形
‘_’ 水平线
‘v’ 一角朝下的三角形
‘8’ 八边形
‘<’ 一角朝左的三角形
‘p’ 五边形
‘>’ 一角朝右的三角形
‘,’ 像素
‘^’ 一角朝上的三角形
‘+’ 加号
‘’ 竖线
‘None’
‘x’ X
颜色color 描述
b 蓝色
g 绿色
r 红色
y 黄色
c 青色
k 黑色
m 洋红色
w 白色
  • 当然也可以使用 HTML 十六进制字符串 color="#123456"

  • plt.subplot() 支持一个窗口绘制多个图形,只需要传入一个百位数如plt.subplot(242) 表示分成2行4列在第二个位置开始绘图

直方图

  • 例子:绘制正态分布(Normal distribution)图
1
2
3
4
5
6
7
8
9
10
11
12
13
14
15
16
17
import numpy as np
from matplotlib import pyplot as plt
samples1 = np.random.normal(0, size=1000) # random.normal 构建一个组基于正态分布的随机数据
samples2 = np.random.normal(1, size=1000)

# 绘制样本直方图
bins = np.linspace(-4, 4, 30)
# bins 定义每个区间的右边缘
histogram1, bins = np.histogram(samples1, bins=bins, normed=True)
histogram2, bins = np.histogram(samples2, bins=bins, normed=True)

# 绘制图像
plt.figure(figsize=(6, 4)) # 指定大小为长 6 英寸宽 4 英寸
plt.hist(samples1, bins=bins, normed=True, label="Samples 1")
plt.hist(samples2, bins=bins, normed=True, label="Samples 2")
plt.legend(loc="best")
plt.show()
  • legend() 指定 loc 参数来指定放置图例的位置,可以使用字符串来代替特定数字表示位置

  • 官方文档给出了解释,下面摘取常用的

best: ‘best’ for axes, ‘upper right’ for figures
The strings ‘upper left’, ‘upper right’, ‘lower left’, ‘lower right’ place the legend at the corresponding corner of the axes/figure.

饼图(Pie Chart)

1
2
3
4
5
6
7
8
9
10
11
import matplotlib.pyplot as plt
plt.rcParams["font.sans-serif"] = ['SimHei'] # 显示中文标签
plt.rcParams["axes.unicode_minus"] = False # 正常显示负号
labels = ['A', 'B', 'C', 'D']
sizes = [15, 30, 45, 10]
explodes = (0, 0.1, 0, 0)
fig1, ax1 = plt.subplots()
ax1.pie(sizes, explode=explodes, labels=labels, autopct="%1.1f%%", shadow=True, startangle=90)
ax1.axis("equal") # 使饼图长宽相等
plt.title("饼图")
plt.show()
  • 一些参数的解释:
    • explode: 饼块偏离中心点的大小
    • autopct: 控制饼图内百分比设置,
    • shadow: 是否在饼图下面画一个阴影
    • startangle: 起始绘制角度,默认图是从 x 轴正方向逆时针画起,如设定为 90 则从 y 轴正方向画起
    • radius: 饼的半径,默认为1

官网上还有好多别的例子,可以学习如何把饼图画的更好

分组条图(Grouped bar chart)

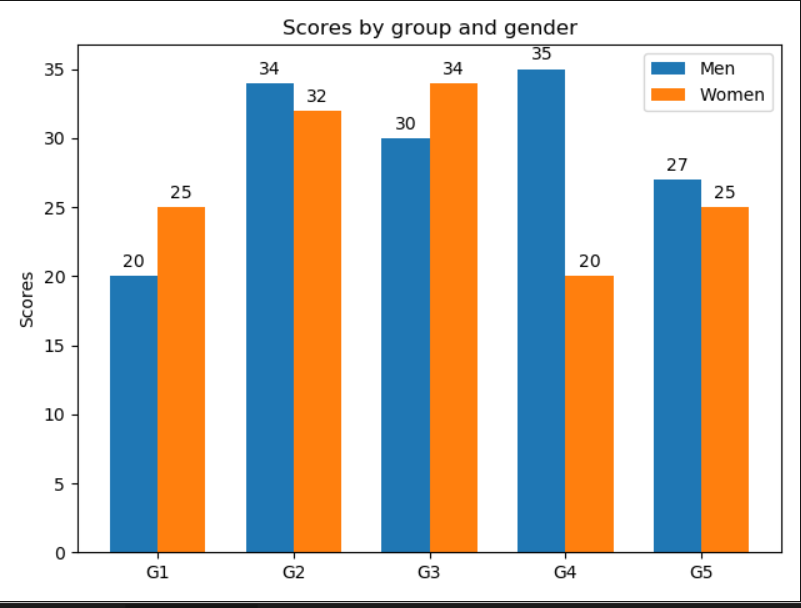
学习官方文档里给出的例子

竖直

1
2
3
4
5
6
7
8
9
10
11
12
13
14
15
16
17
18
19
20
21
22
23
24
25
26
27
28
29
30
31
32
33
34
35
36
37
38
39
40
41
import matplotlib
import matplotlib.pyplot as plt
import numpy as np


labels = ['G1', 'G2', 'G3', 'G4', 'G5']
men_means = [20, 34, 30, 35, 27]
women_means = [25, 32, 34, 20, 25]

x = np.arange(len(labels)) # the label locations
width = 0.35 # the width of the bars

fig, ax = plt.subplots()
rects1 = ax.bar(x - width/2, men_means, width, label='Men')
rects2 = ax.bar(x + width/2, women_means, width, label='Women')

# Add some text for labels, title and custom x-axis tick labels, etc.
ax.set_ylabel('Scores')
ax.set_title('Scores by group and gender')
ax.set_xticks(x)
ax.set_xticklabels(labels)
ax.legend()


def autolabel(rects):
"""Attach a text label above each bar in *rects*, displaying its height."""
for rect in rects:
height = rect.get_height()
ax.annotate('{}'.format(height),
xy=(rect.get_x() + rect.get_width() / 2, height),
xytext=(0, 3), # 3 points vertical offset
textcoords="offset points",
ha='center', va='bottom')


autolabel(rects1)
autolabel(rects2)

fig.tight_layout()

plt.show()

group_chart.png

  • matplotlib.pyplot.bar(x, height, width=0.8, bottom=None, *, align=‘center’, data=None, **kwargs)

    • x: 绘制的左 x 坐标
    • height: 绘制的高度
    • width: 绘制的宽度
    • bottom: 相对于 y 轴的偏移量,默认为0
    • align: 每个图的对齐方式,可选有
      • ‘center’: 中心对齐 x 坐标
      • ‘edge’: 左对齐 x 坐标
      • 需要右对齐的时候往往需要将 align=edge,width 传入一个负值
  • matplotlib.pyplot.annotate(s, xy, *args, **kwargs) 用于将文本放置在指定的 xy 位置

    • text: 要放的文本(s 已经过时了!)
    • xy: xy 坐标
    • xytext: 官方文档里解释是 The position (x,y) to place the text at. If None, defaults to xy. 按例子来看就是一个相对于原 xy 的 xy 偏移值,这实际上和下一个参数有关
    • textcoords: 设置 xytext 的偏移方式,‘offset points’ 表示以点的形式解释应用 xytext 的值,表示 xytext 给出的是偏移度量为点
  • figure.tight_layout()

    • 可以解决一些排布问题,如 label 和图形重叠之类的

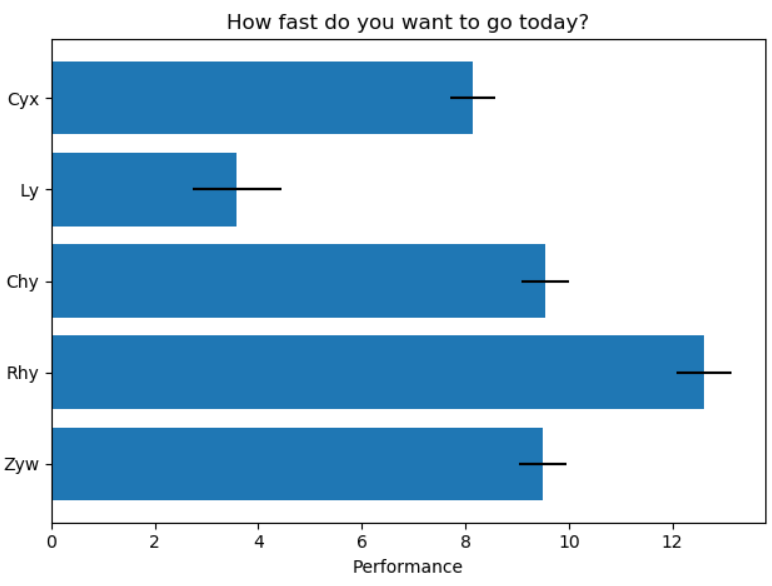
水平

1
2
3
4
5
6
7
8
9
10
11
12
13
14
15
16
17
18
19
20
21
22
23
24
import matplotlib.pyplot as plt
import numpy as np

# Fixing random state for reproducibility
np.random.seed(20200130)


plt.rcdefaults()
fig, ax = plt.subplots()

# Example data
people = ('Cyx', 'Ly', 'Chy', 'Rhy', 'Zyw')
y_pos = np.arange(len(people))
performance = 3 + 10 * np.random.rand(len(people))
error = np.random.rand(len(people))

ax.barh(y_pos, performance, xerr=error, align='center')
ax.set_yticks(y_pos)
ax.set_yticklabels(people)
ax.invert_yaxis() # labels read top-to-bottom
ax.set_xlabel('Performance')
ax.set_title('How fast do you want to go today?')

plt.show()

horizontal_bar_chart.png

  • 基本和竖着的表格一样,这里解释一下 xerr= 这个参数,表示 x 方向上的 error_bar(误差线) 长度
  • invert_yaxis() 函数会翻转坐标轴,即将会按照从上到下排列数据

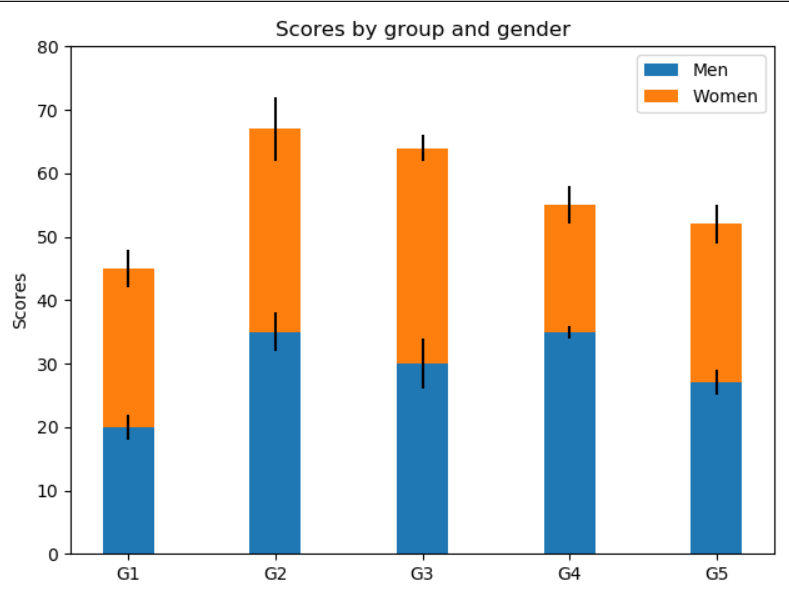
堆积条图(Stack Bar)

1
2
3
4
5
6
7
8
9
10
11
12
13
14
15
16
17
18
19
20
21
22
23
import numpy as np
import matplotlib.pyplot as plt


N = 5
menMeans = (20, 35, 30, 35, 27)
womenMeans = (25, 32, 34, 20, 25)
menStd = (2, 3, 4, 1, 2)
womenStd = (3, 5, 2, 3, 3)
ind = np.arange(N) # the x locations for the groups
width = 0.35 # the width of the bars: can also be len(x) sequence

p1 = plt.bar(ind, menMeans, width, yerr=menStd)
p2 = plt.bar(ind, womenMeans, width,
bottom=menMeans, yerr=womenStd)

plt.ylabel('Scores')
plt.title('Scores by group and gender')
plt.xticks(ind, ('G1', 'G2', 'G3', 'G4', 'G5'))
plt.yticks(np.arange(0, 81, 10))
plt.legend((p1[0], p2[0]), ('Men', 'Women'))

plt.show()

stack_chart.png

有了上面一些函数的理解,不难看懂官方文档里给出的画法

Author

Ctwo

Posted on

2020-01-30

Updated on

2020-10-25

Licensed under

Comments